Remotely debugging Opera for Android
Introduction
Now that Opera for Android is out, you'll sometimes need to debug it, as there are differences in Standards support between Opera and Chrome for Android and Chrome on Android 4+ (<input type=color>, @supports, etc,).
Because current and future Opera for Android releases are based on Chromium, we can't use Presto-based Opera desktop releases to connect to them (wait for Chromium-based Opera desktop releases for that). So here's how to connect Opera for Android to another Chromium-based desktop browser for remote debugging.
Preparing your desktop
You'll be remotely debugging your phone from your desktop, so let's get the desktop ready.
Install Android SDK
The first thing you'll need is the Android SDK — download it and then put the kettle on; it's a 400MB file.
Extract the files to a memorable location, such as /Users/your-user-name/adt or c:android/adt. If you choose something else, use that in the example steps below.
Windows users may need to install Device drivers. Linux and Mac users shouldn't need to.
Install a Chromium-based browser
You'll need a Chromium-based desktop browser. Until Chromium-based Opera desktop releases are available, we suggest Google Chrome, Chromium, or the Yandex browser.
Preparing your device
Ensure that you have a USB cable available to connect your Android device to your computer (the USB power cable should be fine) and Opera for Android installed on it (see the Opera for Android user guide for installation help, if needed.) Keep the phone disconnected from your computer just for now.
Note that you can't remotely debug Opera Mini from desktop, as the rendering is done on our Mini servers and only displayed on the device. (Opera Mini FAQs)
Next, you need to enable USB debugging on your device. Check the "USB debugging" checkbox in Developer Options.
- On Android 2.3, the option is under Settings > Applications > Development
- On Android 4.0 and newer, it's in Settings > Developer options
- On Android 4.2 and newer, go to Settings > About phone and tap Build number seven times to get a message that says "congratulations! you are now a developer". Returning to the previous screen shows previously-hidden developer options.
On Android 4.2.2 and higher, you'll see a dialog asking whether to accept an RSA key. This is a security mechanism; accept the dialog.
When doing mobile debugging on Android it is also useful to check the "stay awake" option that you'll find in the same place as the "USB debugging" option, so the device stays on while plugged into USB, but this isn't mandatory.
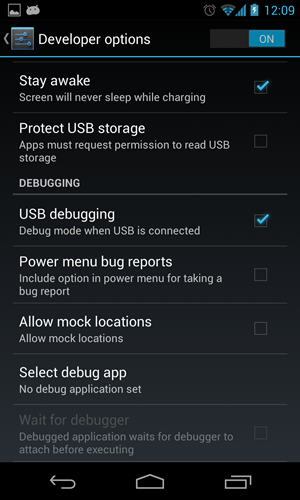
Before moving on, connect your phone to your computer via the USB cable. If it was already connected, try disconnecting and reconnecting it, just to make sure the computer recognises the phone properly. You should see a message on the phone along the lines of "USB debugging connected" to indicate that things are proceeding successfully.
Connect desktop to device
Start Opera for Android, and enable debugging by entering opera:debug in your address bar and checking the "enable" checkbox in the resulting page, as seen below.
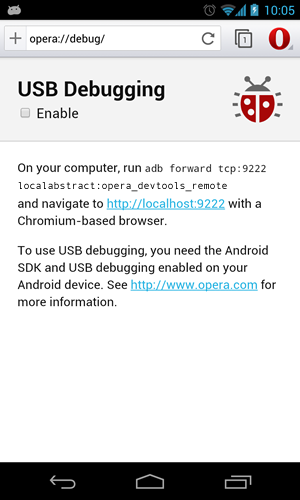
Now let's get the debugger started:
In your computer's terminal, navigate to the directory into which you extracted the Android SDK. Once there, navigate to sdk > platform-tools. Inside there you should see an executable called adb, which is an acronym for Android Debugging Bridge.
To start the debugging bridge, Type in the following terminal command:
adb forward tcp:9222 localabstract:opera_devtools_remoteYou should see a message output along the lines of the following:
* daemon not running. starting it now on port 5037*
* daemon started successfully *
If you are using Linux or Mac OSX, you will have to add ./ at the start of the terminal command above, to tell terminal to look for adb inside the current directory, and not your Path. To avoid having to do this every time, you could add a path to adb in your actual path. You can do this by placing a line in your ~/.profile or ~/.bash_profile like so:
export PATH=/Users/your-username/path-to-adk-folder/adt/sdk/platform-tools/:$PATH
You'll then need to restart the Terminal, or open a new tab.
Debug!
Your device and desktop browser should now be connected and able to send information to each other across the debugging bridge. To begin debugging, go to localhost:9222 in your desktop browser. You'll see a list of inspectable tabs (note that if you open a new tab on the device, you'll need to refresh the Inspectable Tabs page):
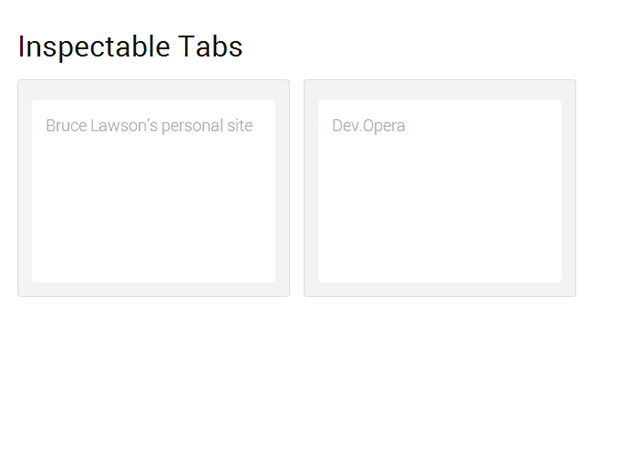
If you instead get a message saying that the server sent no data, or similar, you might have typed in the Terminal command incorrectly. Go back to the Terminal, check it, and try again. There is a very small chance that, if it didn't work, the bridge isn't running, but its process still is. If you still have a problem upon retrying the Terminal command, you might have kill the process directly. This can be done by first typing the command ps -A to bring up a list of running processes, finding the right process ID (the one with "adb fork-server server" in the CMD column), and then killing it with kill your-process-id.
Clicking on one of the inspectable tabs brings up the web inspector full-screen, allowing you to debug, change the page, and all sorts of amazing things:
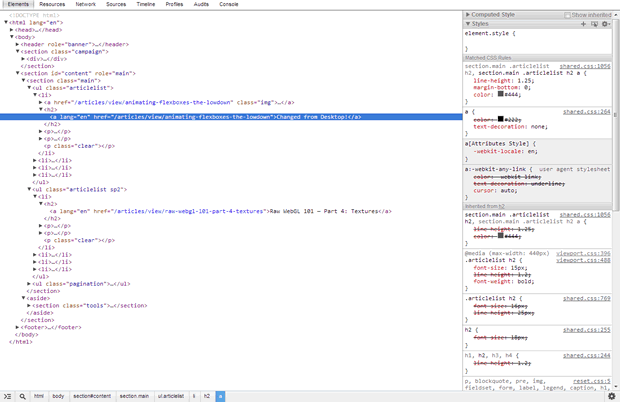
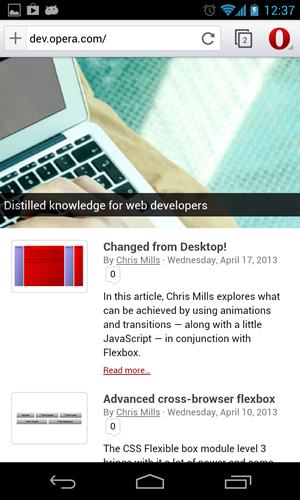
and the changes are immediately visible on your device:
What about Opera Dragonfly?
The current version of Opera Dragonfly (which is Presto-based) won't work with Chromium, hence using the Web Inspector for now. If you'd like to work on future incarnations of Opera Dragonfly, we're hiring!
Cover image by sleepingcatbeads.
This article is licensed under a Creative Commons Attribution 3.0 Unported license.
Comments
No new comments accepted.